Metropolitan Futures Initiative researchers compare neighborhood income, education and occupation mixing across metropolitan areas
By Matt Coker
Greenville, North Carolina, has the highest level of neighborhood income mixing, while the Ogden-Clearfield area of Utah has the lowest level.
The college town of Columbia, Missouri, has the highest neighborhood education mixing but rounding out the bottom in that category are Madera, California; Altoona, Pennsylvania; the Weirton-Steubenville area of West Virginia and Ohio, also known as the Upper Ohio Valley; Dalton, Georgia; and Lima, Ohio.
Neighborhood occupation mixing is generally quite high in the Midwest and generally lower in the South.
Those are just some of the findings of “Rising inequality and neighborhood mixing: Comparing across metropolitan areas,” the Metropolitan Futures Initiative (MFI) 2020 Quarterly Report.
The report’s authors are John R. Hipp, MFI director, Irvine Lab for the Study of Space and Crime co-director and professor of criminology, law and society, urban planning and public policy and sociology; Kevin Kane, who was Hipp’s post-doctoral student when the report was being drafted but now an affiliated researcher and demographer with the Southern California Association of Governments; and Benjamin Forthun, a UCI criminology, law and society doctoral student. Jae Hong Kim, associate professor of urban planning and public policy and member of the MFI executive committee, also was part of the research team.
The MFI report attempts to provide new insights into some of the spatial relationships involved in both neighborhood mixing and regional inequality through an investigation of 381 metropolitan areas in the U.S. using advanced measurement strategies and analysis methods, according to the “big data” researchers.
Other location studies have used areas within census tracts or ZIP codes as subject boundaries, but few people know which census tract they reside in and ZIP codes were designed for mail delivery, not spheres of unique neighborhood influence. So the MFI team came up with a measurement they call an “egohood,” which includes neighborhoods within a 1.5-mile radius of the center of a census block.
“This is intended to capture a person’s activity space where they may have meaningful proximity to others at places like nearby schools, stores, or parks,” explain the researchers, who also employed Kernel Regularized Least Squares (KRLS), a new machine learning technique that evaluates the magnitude of voting, crime rates, recent growth and new housing construction in neighborhood mixing.
From his office, Hipp explained the seed for the report was work that was being done by Kane and that had been done before by Richard Florida, a renowned American urban studies theorist and professor who heads the Martin Prosperity Institute at the Rotman School of Management at the University of Toronto.
In numerous studies, including the 2017 book “The New Urban Crisis,” Florida has drawn connections between like and non-like people residing close to one another and the economic productivity of what he calls the “creative class.” He argues broadly that fast-growing, “superstar” regions characterized by innovation, venture capital and price appreciation tend to be the most unequal overall. His reasoning suggests that segregating the wealthy is in the best interest of superstar cities.
“We were interested to see if some of Richard Florida’s ideas would hold up with more innovative measurements of mixing in communities that we had done,” Hipp explains. “You know, we found some limitations to his approach. Ours came up with different findings at some points and similar findings at other points, so in that way it was an interesting exercise.”
The report and other MFI work is important because they help develop an improved understanding of communities and their potential for integrative and collaborative planning and action to ensure a bright future for inhabitants, according to the researchers. But most previous MFI work has been more focused on Southern California.
“With this one, we were interested in a broader perspective, with all regions of the U.S. represented,” Hipp says. “We were interested in the level of mixing within neighborhoods. Which places do and do not have the most mixing provides some important insights. People can see [mixing or the lack thereof] anecdotally, but we can actually measure that and compare different regions.”
People in different areas can therefore see how their regions rate so they can plan their urban futures accordingly, Hipp notes.
Meanwhile, Hipp says he is involved in many other MFI projects, including one that somewhat relates to the “Rising inequality and neighborhood mixing” report.
“We’re focusing our next report on Southern California,” he says. “We want to look at long-term changes in different counties. We’d done a report 10 years ago that showed how things were changing in Orange County relative to inequality and similar characteristics. The new report will be a follow up on that.”
Stay tuned, SoCal.
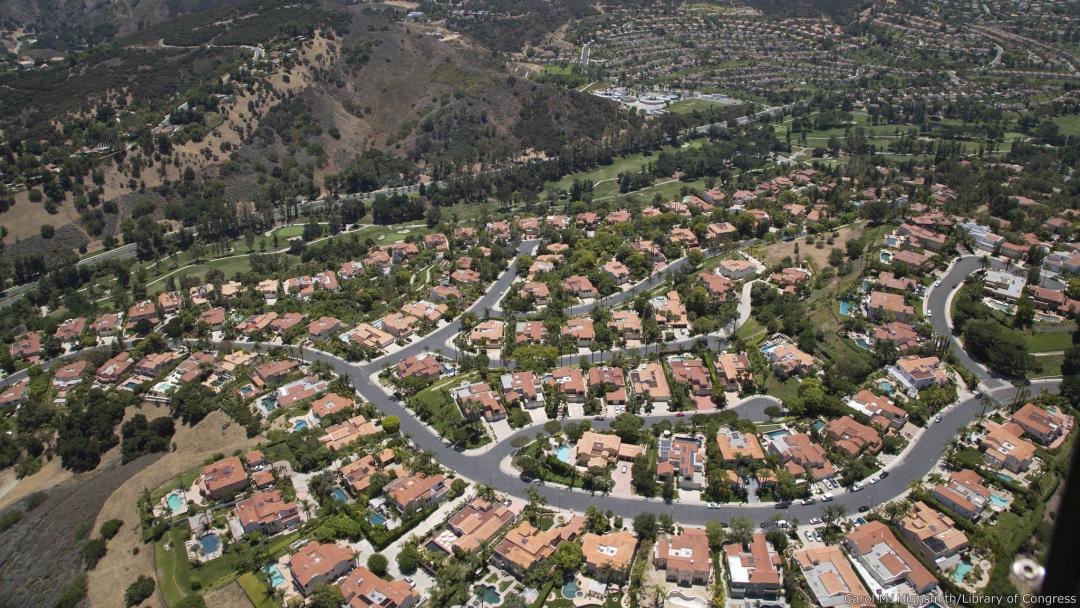
Banner image: neighborhood in Los Angeles. Photo by Carol M. Highsmith
Media contact:
Mimi Ko Cruz
949-824-1278